
Effective Kubernetes Monitoring
Topics in this article:
For modern digital ecosystems, Kubernetes has cemented itself as the preferred platform for application deployment and management. Its distributed nature enables deployment of resilient, scalable, and highly available applications across a variety of cloud providers. For more reasons why you may want to select Kubernetes, consider our insight: Why Kubernetes?.
As organizations increasingly adopt Kubernetes for deploying and managing their applications, they face a critical challenge: how to effectively monitor and maintain the health of these dynamic, distributed systems. Fortunately, a vibrant and mature ecosystem of monitoring and alerting tools and standards have emerged to help enable teams to effectively monitor their distributed clusters and applications.

In this article, we will explore an opinionated stack of open-source applications designed to address the unique monitoring requirements posed by a distributed Kubernetes environment. We'll explore some of the challenges that arise with monitoring distributed workloads in a Kubernetes cluster. Then, we'll will dive into specific solutions designed to address these challenges, each one aligned to address one particular monitoring concern.
The stack presented in this article is not meant to be comprehensive or exhaustive, but rather a great, generic starting point for considering the monitoring solutions that are best suited for your organization. Many cloud providers offer built-in monitoring solutions that may be easier to configure and require less work such as AWS CloudWatch, Google Cloud Monitoring, and Azure Monitor as well as a large number of commercial offerings.
Challenges
Distributed environments add an extra layer of complexity to the monitoring process. In older systems, applications were deployed to a single server and application logs lived alongside those servers. In Kubernetes however, applications can be spread across any number of underlying nodes or pods, with a series of load balancers along the way. Requests and traffic will be distributed arbitrarily and there is no guarantee that even subsequent requests from the same client may end up on the same server. Therefore, we need solutions that are built from the ground-up to operate in this dynamic setting.
Metrics
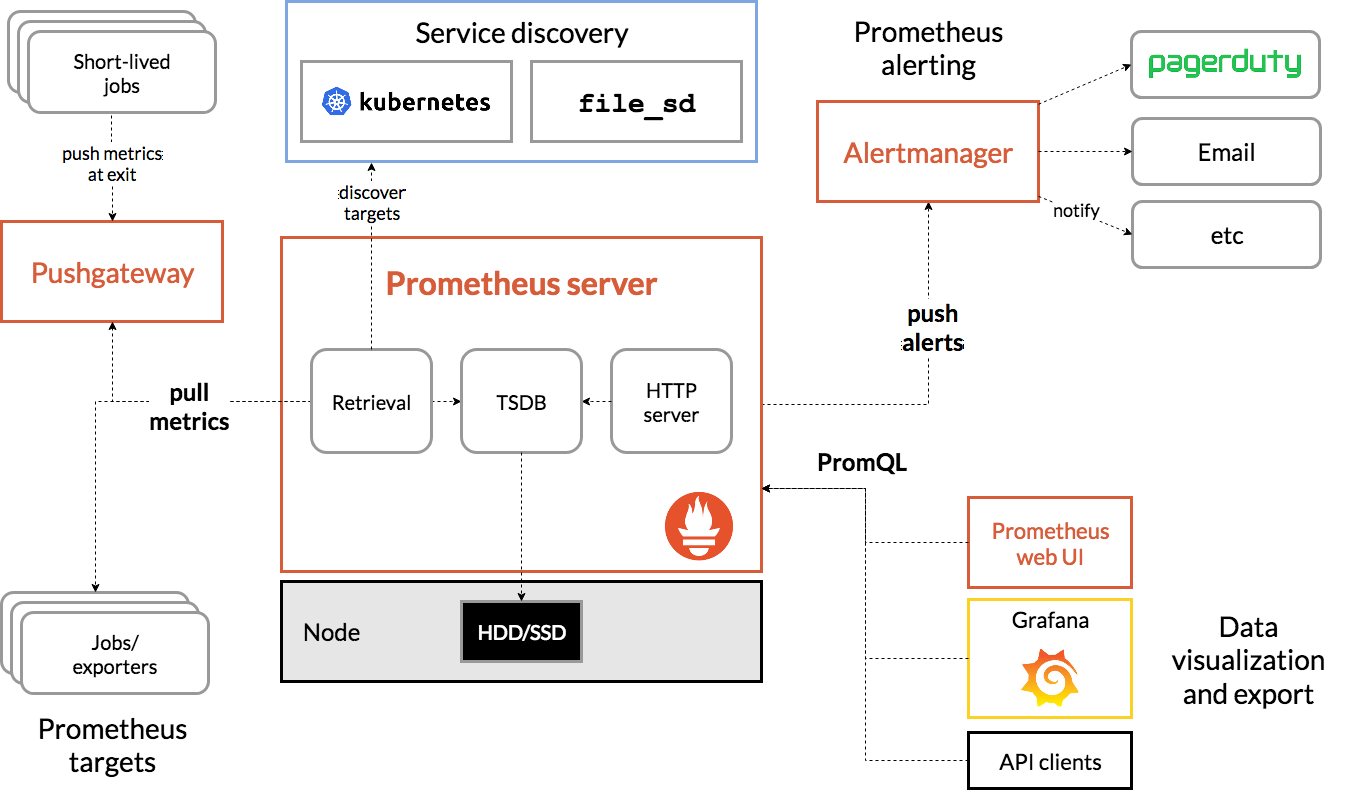
Prometheus is the core of our distributed metrics collection and aggregation solution in the Kubernetes ecosystem. It is a powerful open-source tool that collects metrics from various sources and stores them in a time-series database. These metrics are annotated with various bits of metadata (called "labels") that associate the data with their source container, service, pod, cluster, and other useful identifiers.
Adding applications to Prometheus is simple. Applications must be configured to expose their metrics in a format that
Prometheus can ingest, a simple text-based format called
Prometheus exposition format, through a simple HTTP endpoint (typically /metrics). Prometheus can either be
configured with a new “Scrape target” job or rely on
Prometheus's Service Discovery
functionality to locate the application. Prometheus will then periodically make an HTTP request to the configured
endpoint, scrape the metrics, enrich them with metadata, and store them in its time-series database. Once in the
database, using the built-in query language PromQL, the metrics can be retrieved and visualized using Grafana.
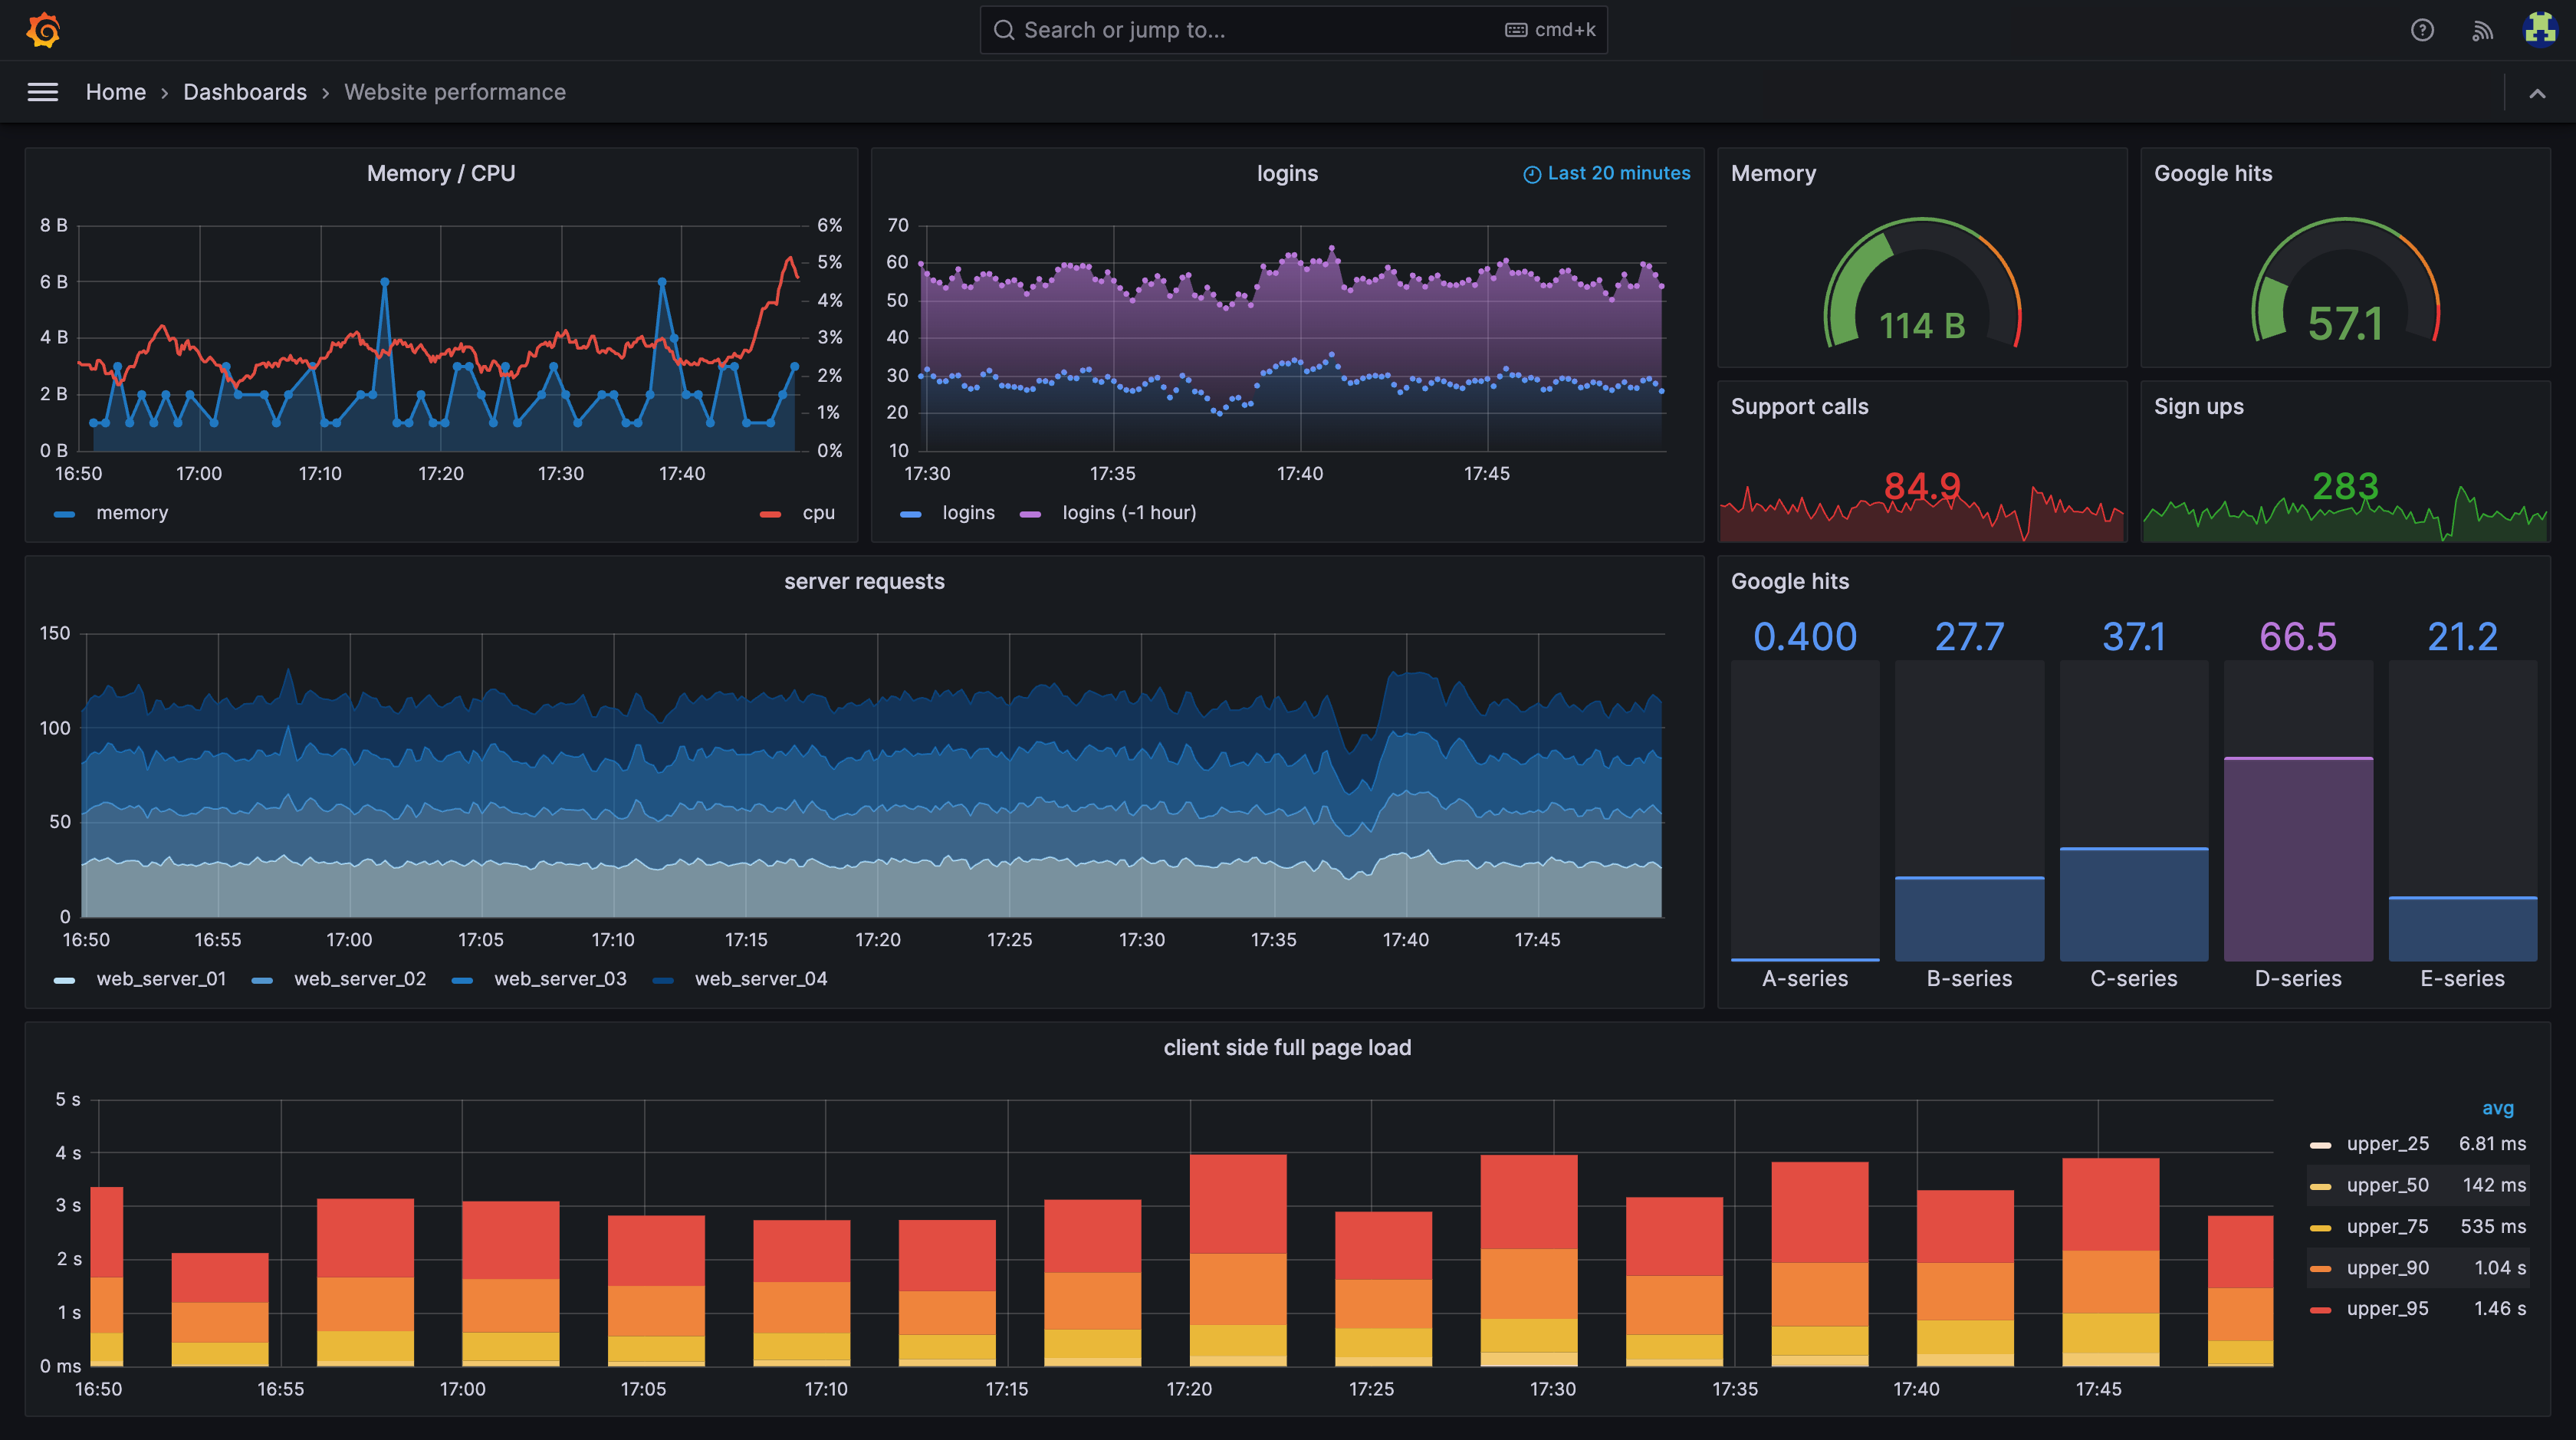
Visualization
Grafana is an open-source tool from Grafana Labs that enables metrics visualization in a graphical dashboard. With Grafana, we can turn our text-based metrics into visually appealing graphs and charts that are easy to understand. These charts can be combined into dashboards that can be used to provide an at-a-glance visualization of the health and status of a cluster or application or used for deep diving during debugging and incident response. Representing data in a visual way can be an easy way to look for anomalies or irregular performance.
Alerting
Alertmanager is a tool often deployed alongside Prometheus that allows us to set up alerts based on collected metrics. By configuring rules that trigger when certain conditions are met, we can be notified when something goes wrong. Alertmanager is easily configured by writing simple PromQL queries, run against a Prometheus instance, with defined actions when conditions are met. These actions are commonly used to send a notification through a communication channel or trigger an alert through something like PagerDuty or OpsGenie. By utilizing Alertmanager in our monitoring stack, we can create more actionable data that can help prevent downtime and service interruption.
Log Forwarding
Centralized logging is a critical component of any monitoring solution. Being able to view all application logs in a central location is essential for debugging, troubleshooting, and auditing. To be able to view the logs, we must first get them off our nodes by forwarding them to a central log aggregator. Due to the distributed nature of Kubernetes, our application nodes can be scattered across any number of discrete virtual machines. Each node orchestrates applications that are generating their own logs which must be aggregated in a central location.
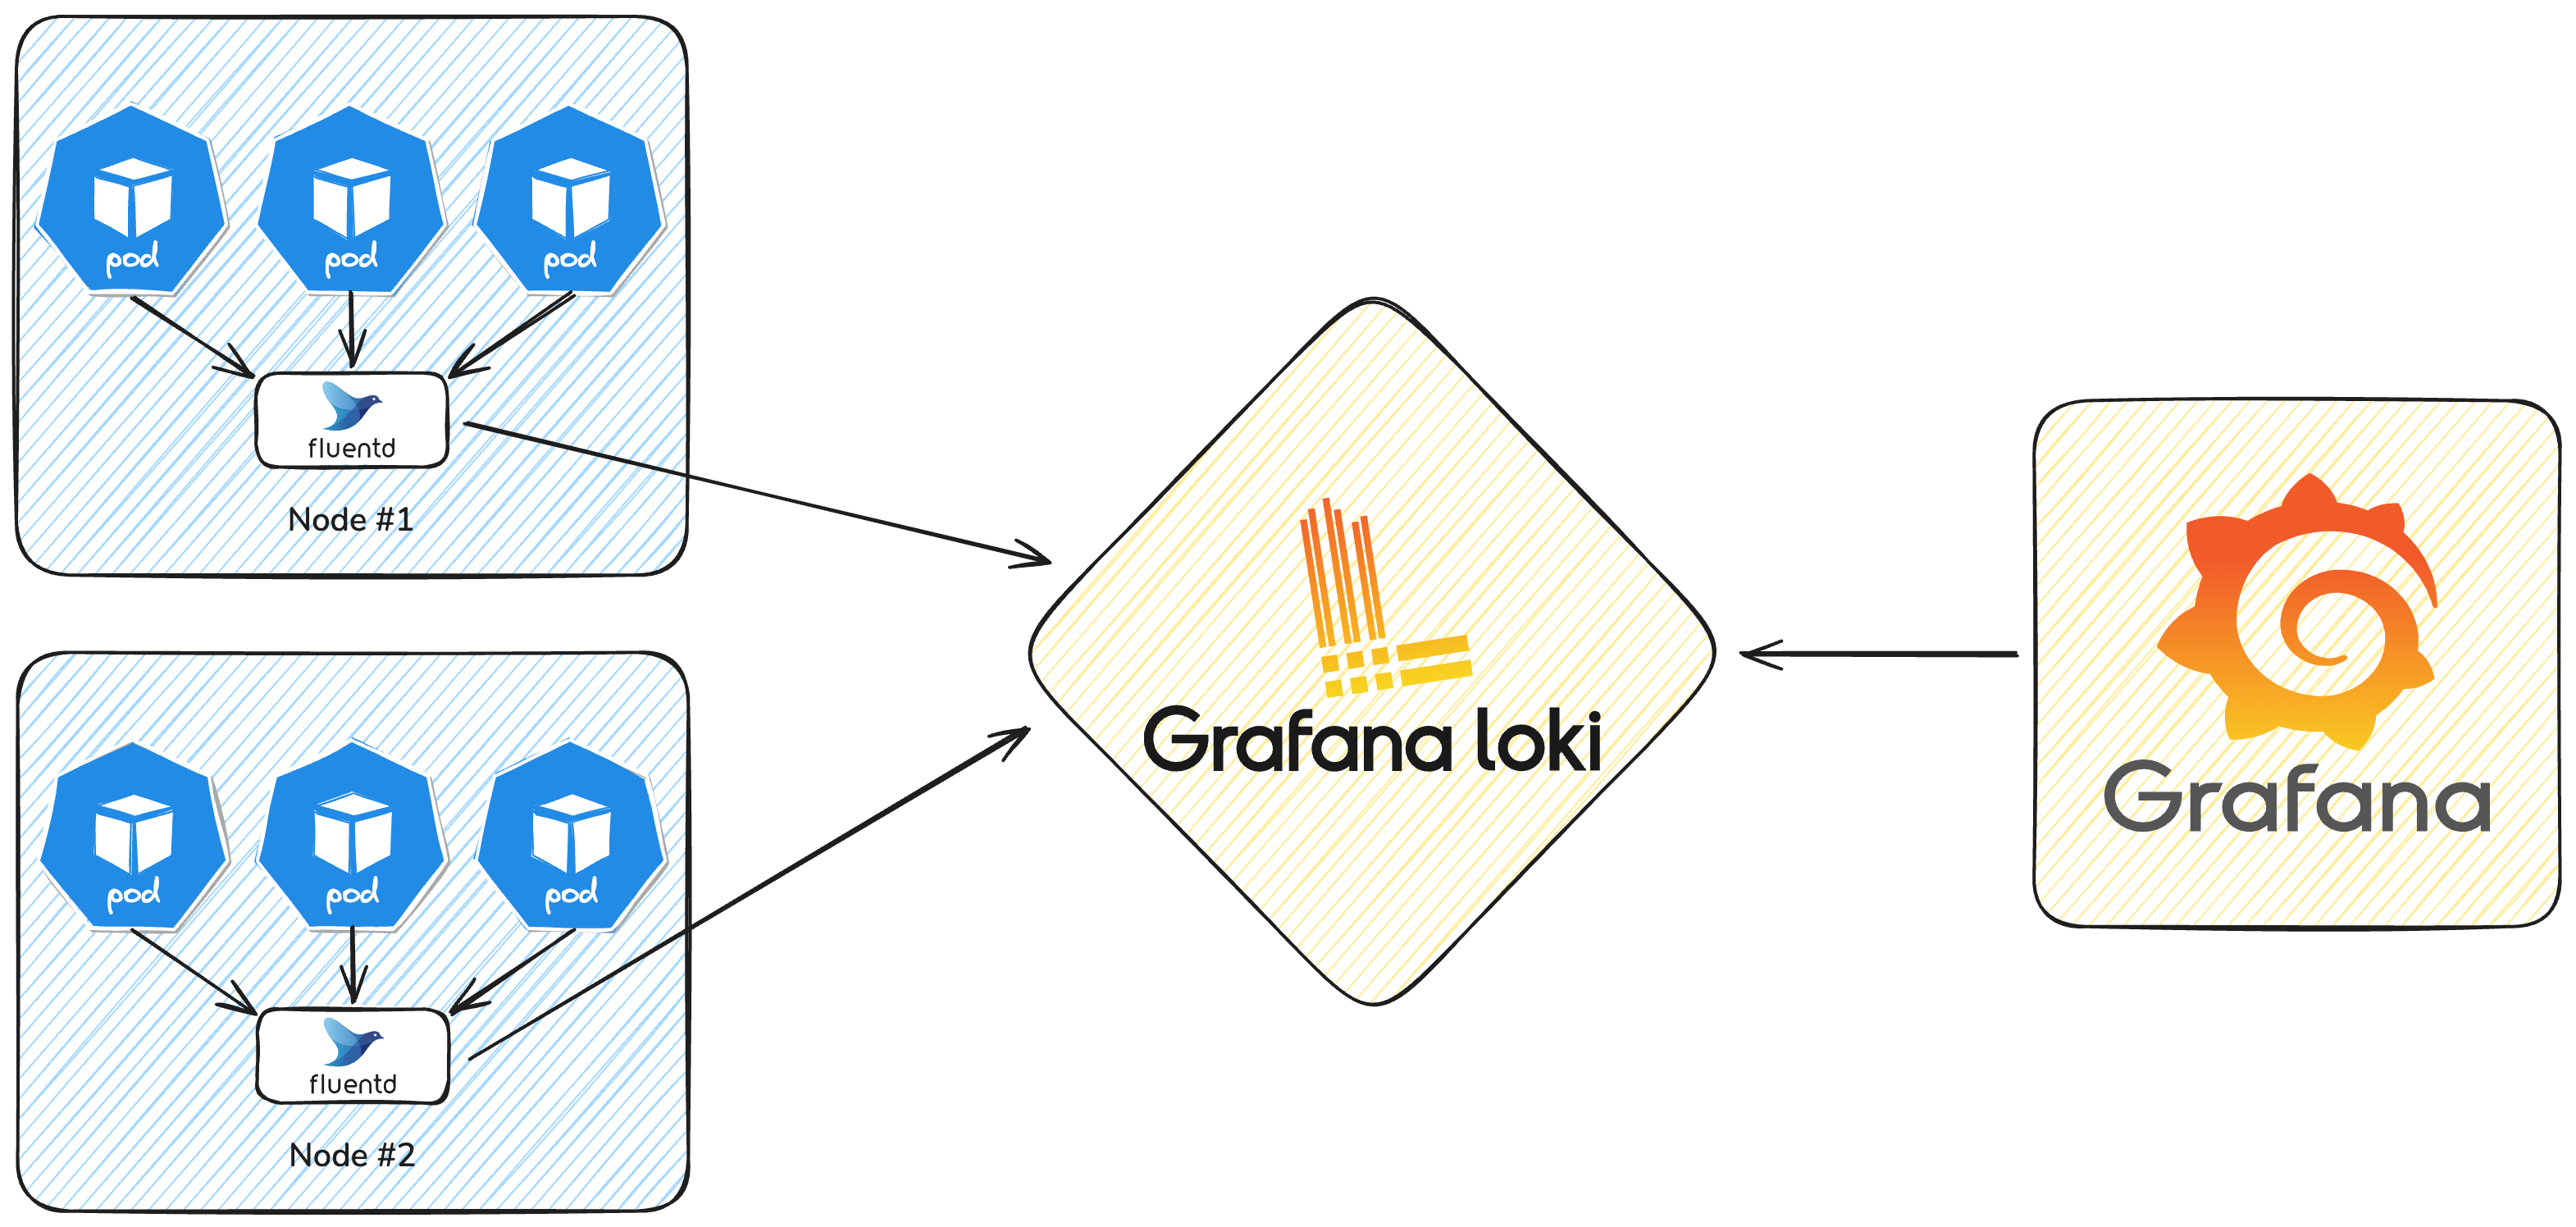
Fluentd is an agent-based log forwarding tool that collects logs from various sources and forwards them to a variety of destinations, including Elasticsearch, Splunk, and Grafana. Typically deployed as a Kubernetes DaemonSet, Fluentd deploys an agent on every approved node in the cluster that watches the local container runtime logs, enriches the logs with metadata about the container, pod, node, etc, and forwards the logs in batches to an upstream log aggregation system.
Log Aggregation
Loki is another open-source project from Grafana Labs that provides a centralized log aggregation solution with tight Grafana integration. Logs forwarded to Loki by a log forwarding agent like Fluentd are annotated with a set of labels and stored in its built-in, horizontally scalable log storage engine. These logs can then be retrieved using a simple query language similar to PromQL and even parsed and visualized with Grafana dashboards. Using a common set of labels and timestamps, Grafana is able to visually display application metrics alongside the relevant application logs. Loki also offers rudimentary log-parsing functionality, to generate additional metrics from log data provided. This tight integration between metrics and logs can help more clearly show trends and help with incident response and debugging.
Kubernetes Monitoring with BridgePhase
BridgePhase has years of experience designing, deploying, and maintaining monitoring solutions for Kubernetes across a variety of critical production environments. Our experienced team of Platform and DevSecOps engineers utilize their experience to provide monitoring solutions for critical workloads across the federal government, including developing a hardened Kubernetes platform with an integrated, “batteries-included” monitoring stack for Platform One Big Bang, utilized across the Air Force value streams. Big Bang enables easy one-click deployment of the entire monitoring stack mentioned in this article as well as additional features and functionality.
Closing Remarks
This is just the tip of the iceberg when it comes to monitoring in Kubernetes. There are many other tools and technologies that can be used to monitor Kubernetes, and the list is growing every day. All projects and situations are different. The monitoring stack presented in this article is not meant to be comprehensive or exhaustive however it is a great starting point for considering the monitoring solutions that are best suited for your organization. These tools have been built from the ground-up to be cloud native and are tailor-made to handle the specific requirements Kubernetes presents.
For a more comprehensive list of monitoring tools and technologies, check out the CNCF landscape, the interactive Big Bang Universe page, and the documentation pages for the aforementioned applications:
Topics in this article: